Chart Analysis
Chart Analysis
If you’re new to the world of trading, it can be difficult understanding all that’s happening. And this lack of understanding can really harm the performance of your portfolio. Trading is all about being willing to take calculated risks. Trading signals are just one of many tools that are available to help you understand and feel more secure and informed in your trading decisions.
An introduction to analyzing trading charts
Trading charts show the change in price of market assets. There’s a chart for each trade so you can see its historic patterns so you can decide to trade based on current events or the price history of an asset. Or both, of course. Technical traders are those who use the trading charts for analysis.
Understanding trading chart analysis
Trying to analyze the changes in asset prices without a chart would be a nightmare. There is so much data to collate and evaluate. Charts are great for visualizing information and make it easier for us to comprehend large amounts of facts and figures. They’re also excellent at showing how those facts and figures have shifted over time. This makes them valuable, yet flexible tools for analyzing the changes in your asset. You can choose the timeframe (hours, days, quarters, years) so you can focus on either the big picture or details of recent events. The time frame is determined by the kind of analysis you’re doing.
Types of trading charts
There are many kinds of charts for analyzing price changes in assets you’re considering trading. Choose the one best suited to your preferred type of analysis. The following are the three most popular charts used across the globe. Each is easy to use with some basic knowledge.
High-low open-close charts
This chart features narrow bars with small bumps on each side. The smaller bar on the right shows the closing price of an asset, while the left bar shows the opening price. The bar peaks at the top price for the asset during your selected timeframe. The bar bottoms out at the asset’s lowest price during your chosen timeframe. Green bars show upward price movement, while red is for downward price movement. This chart has many similarities to the candlestick chart described below.
Candlestick charts
This type of chart is called a candlestick chart because it looks like a series of candlesticks. The stick and the wick contain four different kinds of data for your asset: opening and closing price, top and lowest price. A green candlestick means the price is moving up, while red means it’s moving down. Every candlestick is created based on your chosen timeframe. For example, if you select 3 hours as your timeframe, each candlestick reveals how much an asset’s price has changed over the last 3 hours. The various colors, sizes, and lengths of the candle’s ‘wicks’ reveal different data points about changes in the market.
Line charts
Line charts are much more basic and offer less types of data than those described above. They simply show a line that continues to move toward the right side of the graph, going up and down based on the changes in asset price over a chosen time frame. This is the ideal type of chart for looking at price trends over longer time frames. You won’t be focused on the high or low price of the day nor the opening or closing prices; instead, you can focus on the long-term trends over time. Another chart that works similarly but with a shaded bottom is known as a mountain chart.
In conclusion
Trading charts are an invaluable tool for analyzing changes in asset prices over time. Use different types of charts and time frames for big-picture and fine-detail analyses to enhance your knowledge and confidence as a trader. You’ll also want to learn more about other tools such as trading signals that will help you decide whether it’s time to buy or sell an asset. But charts and signals can never replace your own common-sense judgment: they are merely guides filled with historical data. They can never guarantee what an asset will do in the future.
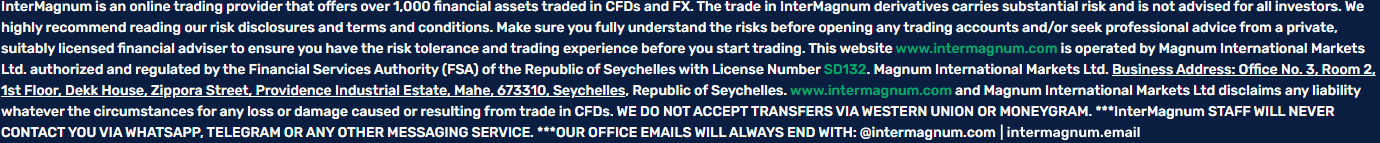
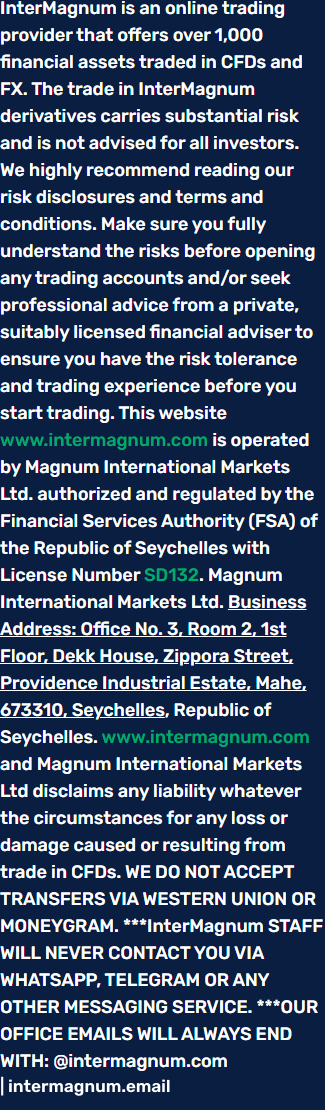
DBS Capital is a financial services provider, offering a selection of more than 70 financial assets as CFDs to traders from almost all around the globe. Thanks to our intuitive trading platform, you get access to the world’s most exciting and volatile exchange market via your desktop, smartphone or tablet device. By doing so, you are able to manage your personal trading portfolio while enjoying immediate 1-click trading execution, all through a single smart dashboard display.
While our aim is to help clients make the most out of online trading, access liquidity, and manage risk effectively, our practical expertise,
comprehensive technology and unparalleled network allow us to deliver an unforgettable trading experience.
We have the technological expertise and the vast resources to help you unleash your full potential and take advantage of unparalleled trading experience. We use state-of-the-art encryption technology as international banks and major online retailers do in order to protect your information, security and privacy at all times. While featuring around-the-clock live support and delivering world-class solutions to clients, we constantly monitor your trading funds and protect them in segregated accounts.
We are obligated not to share your personal details with any outside agency or third party and operate under a guaranteed no hidden
fees policy with our deposits and withdrawals process being fast and convenient.
We have the technological expertise and the vast resources to help you unleash your full potential and take advantage of unparalleled trading experience. We use state-of-the-art encryption technology as international banks and major online retailers do in order to protect your information, security and privacy at all times. While featuring around-the-clock live support and delivering world-class solutions to clients, we constantly monitor your trading funds and protect them in segregated accounts.
With CFDs becoming more increasingly popular amongst modern traders and investors, here are some of the exceptional features and benefits you can enjoy when deciding to build your personal trading portfolio with us:
- Live Data Feed
- 24/6 Customer Service
- Customized Analysis Tools
- Selection of Trading Accounts
- Advanced Charts and Graphs
- Personal Account Managers
- Simple Account Management
- Quick Deposits and Withdrawals
We want to make secured CFD trading a living reality for all the millions out there that can’t afford themselves to trade traditionally.
Through our innovative technology, we want to build a financially proficient environment which is based on the foundation of mutual trust and
respect between us and our clients.
In a world filled with financial institutions, we take pride in providing the strictest protection to your funds at all times.
As your trading portfolio is constantly safe with us, we’ve developed a whole new standard for your personal data safety and security.
All of our traders benefit from the following conditions:
Segregated Client Accounts
In the financial trading industry, this account is being used to
hold your funds separately from the broker’s funds. This ensures
that your capital is safeguarded by world-renowned credit
institutions and can be easily identified.
Encryption and Protection
Using highly advanced security measures and safety protocols, we treat your account with full confidentiality, resulting in your trades and private information being 100% SSL encrypted and securely stored.
We are fully committed to providing you with all the support and assistance you need in your native language and around the clock.
If you have any questions or require technical support or guidance concerning your account management, feel free to contact our customer support team at any given time.